
.avif)
Product
/
June 2026
The science behind the small signs you need a hearing test

Reviewed by Bess Nagler, Au.D.
You can pass a hearing test and still feel like everyone around you is mumbling. You hear the waiter, the dinner guests, the person on the other end of the call, and yet, in a crowded room, the words keep dissolving into noise. It's a frustrating gap: the test says you're fine, but your daily life says otherwise.
The audiogram sits at the center of that gap. It's the chart you walk away with after a hearing test, and it's one of the most useful tools in audiology. But it answers a narrower question than most people assume. Understanding exactly what an audiogram measures (and what it doesn’t) explains why "normal hearing" and "no trouble hearing" aren't the same thing.
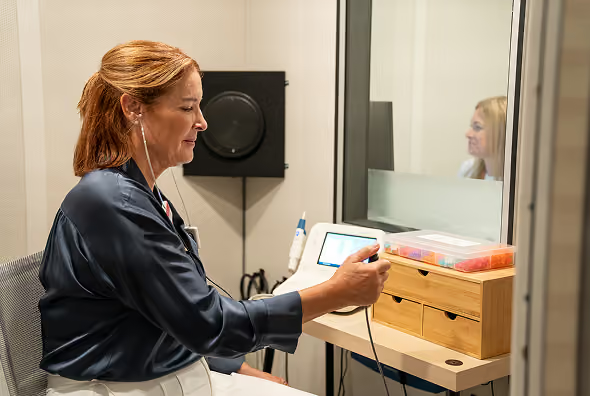
An audiogram is the graph that results from pure-tone audiometry, the most fundamental hearing test. An audiologist uses a calibrated device called an audiometer to play single-frequency tones called "pure tones," and finds the softest level at which you can reliably detect each one.
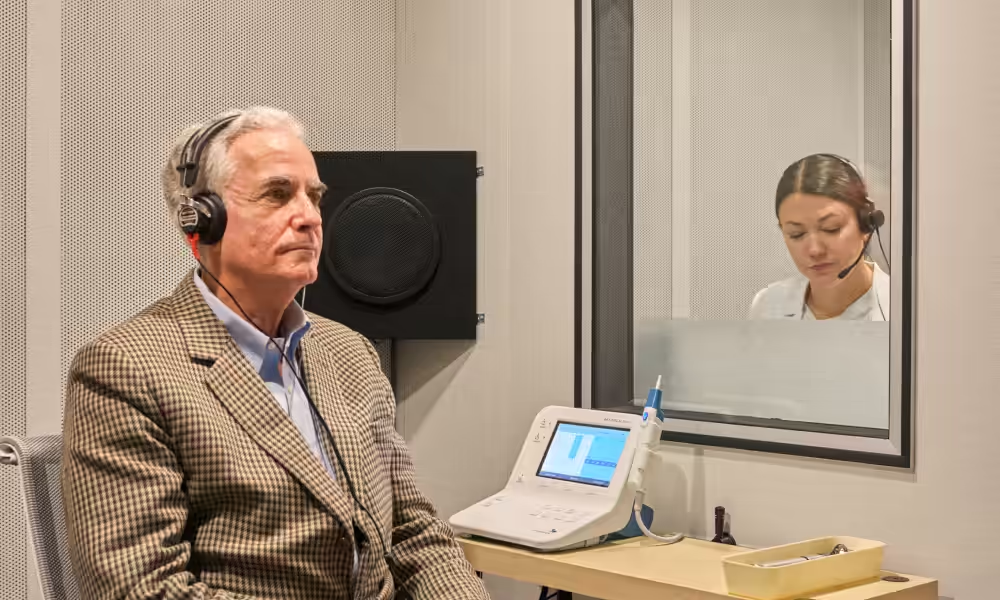
You’ll sit in a quiet, usually sound-proofed, booth wearing headphones or insert earphones, and you signal (raise a hand, press a button) every time you hear a tone. The clinician obtains your threshold at each frequency: the softest intensity you can detect at least 50% of the time.
Testing typically covers frequencies of 250, 500, 1000, 2000, 3000, 4000, 6000, and 8000 Hz — the range that contains most of the information in human speech. Each ear is tested separately, and the process takes about 15 to 20 minutes.
Results are plotted with standardized symbols that encode ear, transducer, and masking status. The common conventions:
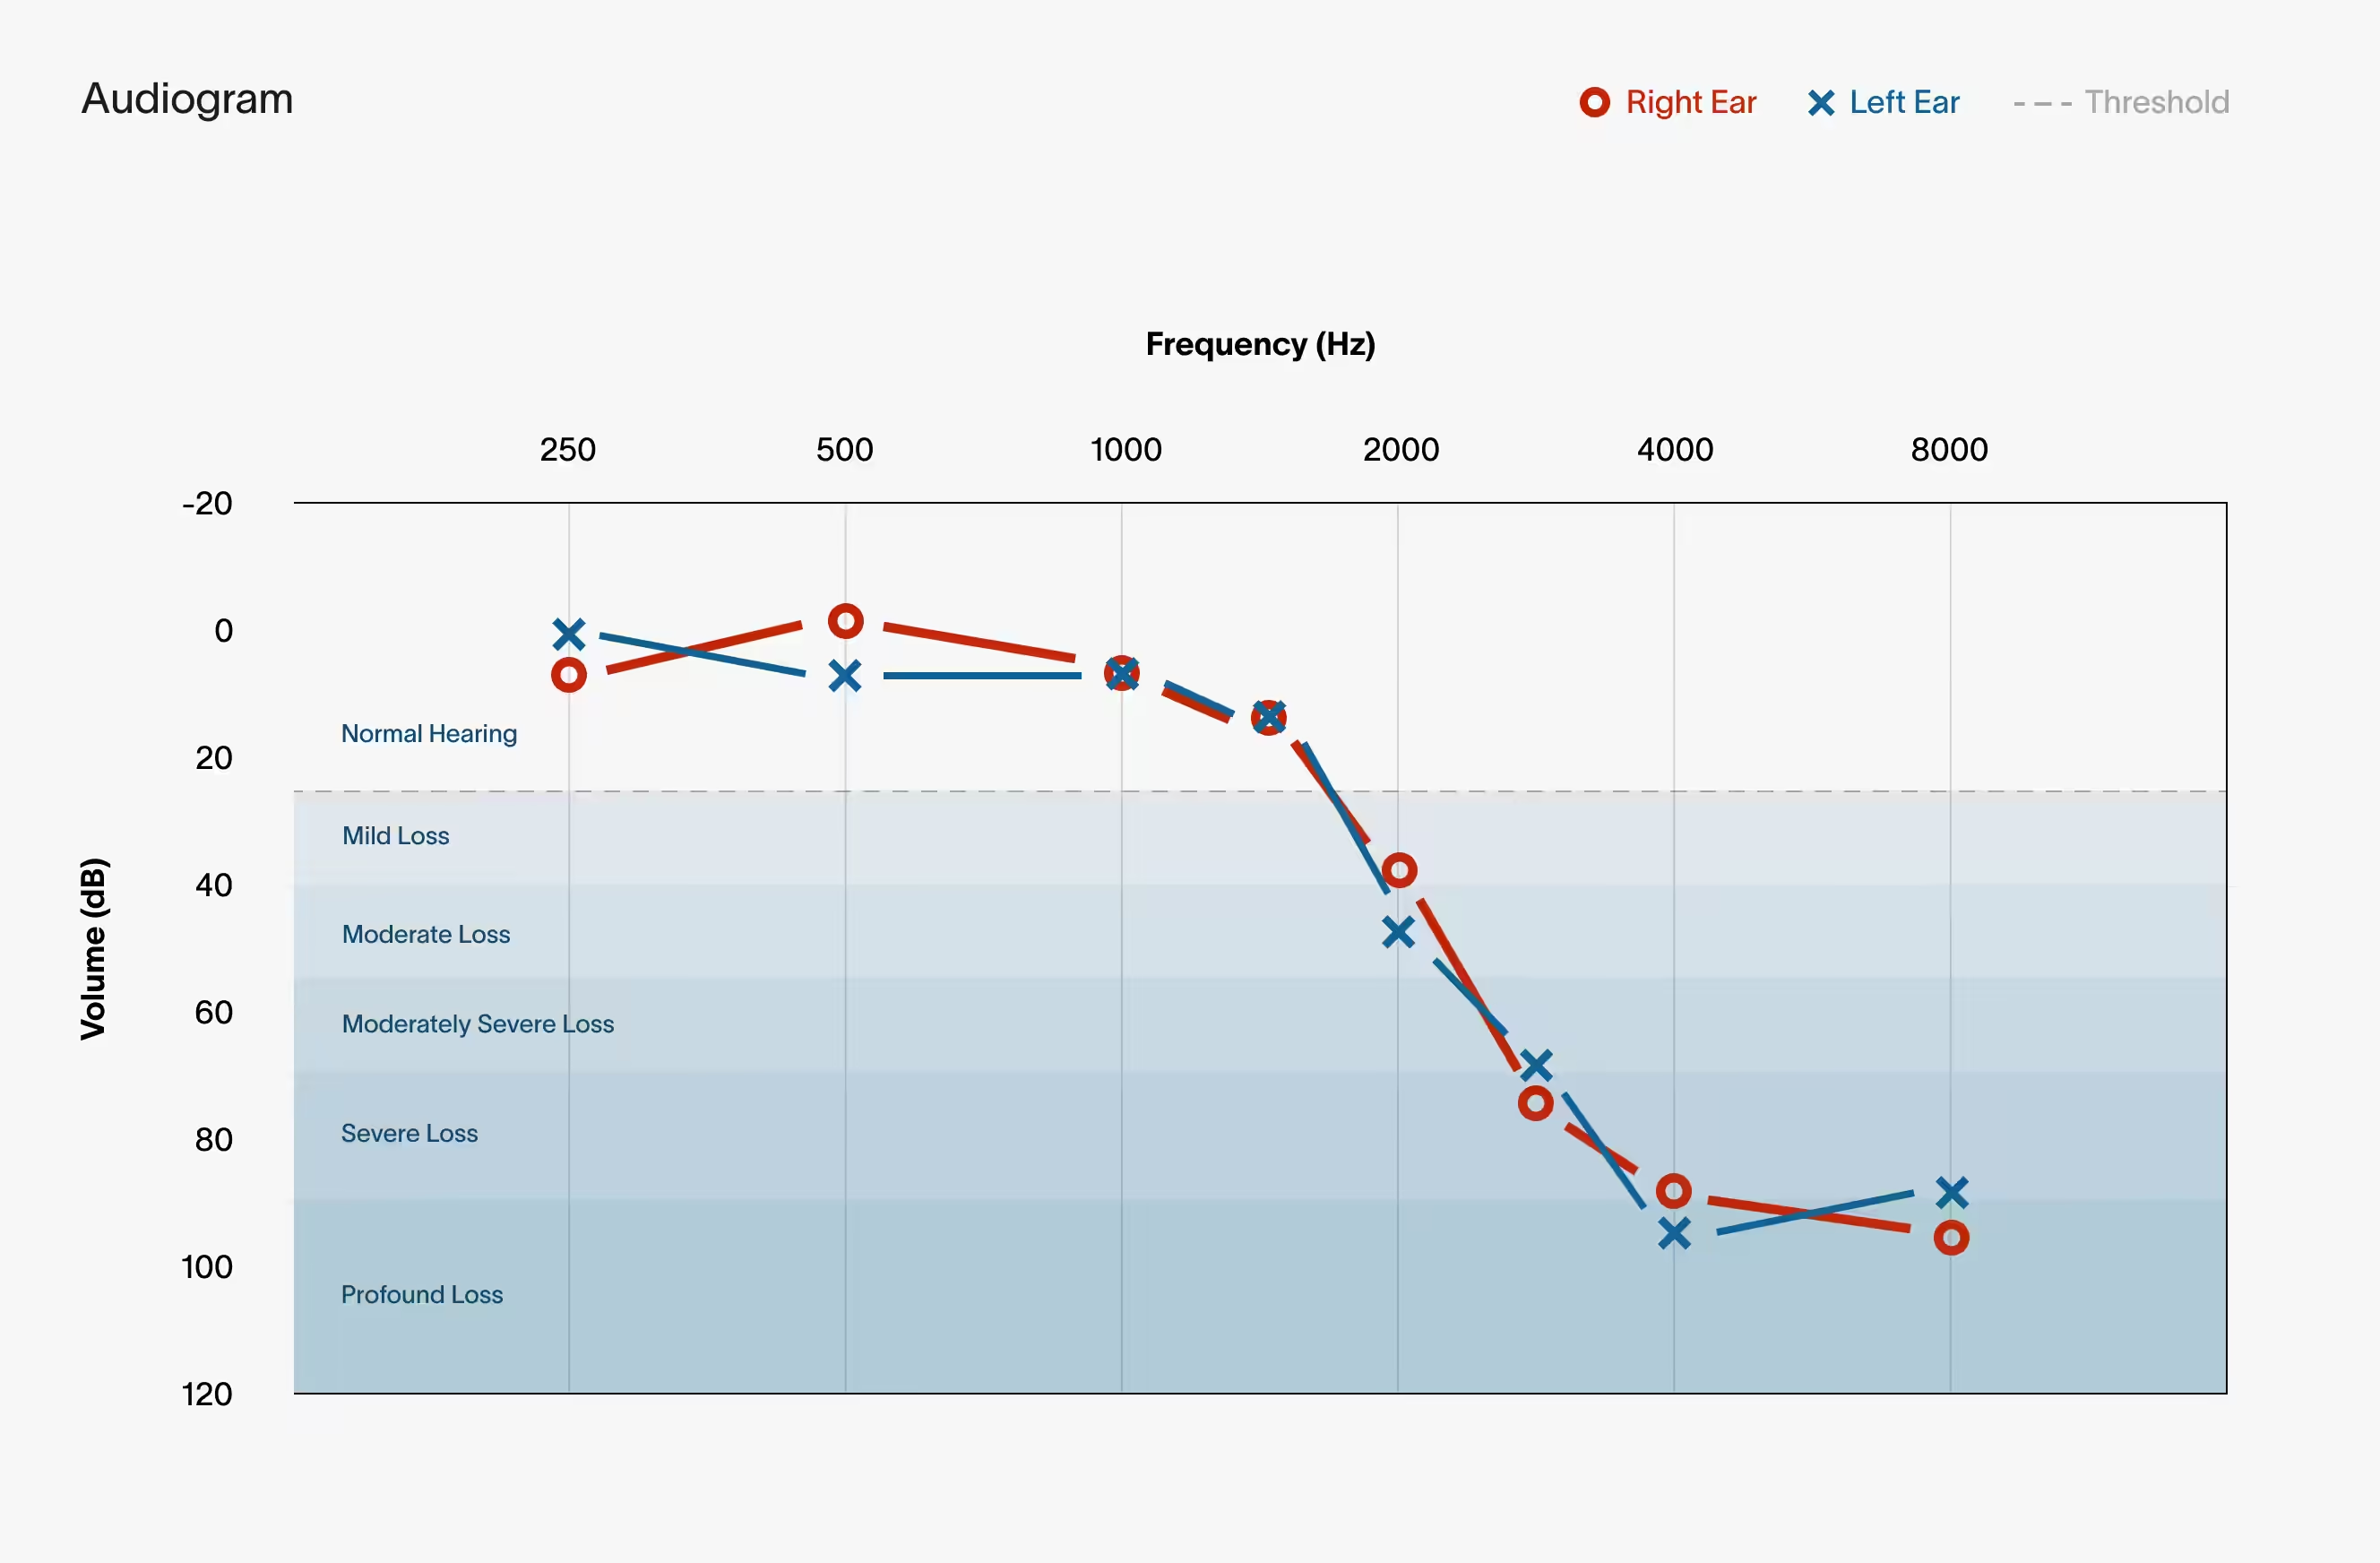
The chart isn't the end point, it's the input to a diagnostic reasoning process. Audiologists read three dimensions of your audiogram.
Thresholds are matched to severity categories, often using a pure-tone average (PTA) across several speech-relevant frequencies. A widely used framework:
Exact cutoffs vary slightly between sources and institutions. But the above framework is generally accepted.
Where the loss sits across the frequency range matters as much as how much loss there is on average.
The high frequencies are where the action is, because that's where the consonants that carry meaning in speech live. These are sounds like s, f, th, and k that distinguish one word from another. These are often the first frequencies to go in sensorineural (age related) hearing loss.
In many practices, any degree of hearing loss at 2000Hz or above is treated as the point where someone becomes a hearing aid candidate.
The pattern across frequencies often points toward a cause. A few classic signatures:
From these two readings, an audiologist can produce a precise description such as, "right-sided moderately severe high-frequency sensorineural hearing loss," and use it to guide next steps including

The audiogram answers one question extremely well: “what is the softest sound you can detect at each pitch?” And that question, called audibility or threshold sensitivity, is only one ingredient in real-world hearing. Difficulty understanding speech in noise is the single most common complaint in audiology clinics, and the audiogram frequently fails to explain it.
A threshold counted as "normal" can span a 30 dB range. Two people both labeled normal-hearing can have meaningfully different ears, and someone at the edge of normal could already have real cochlear damage that the category simply doesn't register. Normal on an audiogram is not the same as "nothing wrong."
The audiogram measures whether a sound is audible, but audibility isn't comprehension. You can hear that someone is talking, register that the sound is there, and still not be able to make out the words.
That's the difference between hearing and listening. Hearing is detecting that sound exists. Listening is your brain pulling the signal apart: separating one voice from another or hearing a voice in a noisy space. An audiogram only measures audibility, so two people with similar audiograms could have very different experiences at a noisy dinner.
This is why a thorough hearing-and-communication assessment goes beyond the threshold audiogram. The most important addition is speech-in-noise testing, which measures the thing people actually struggle with: understanding words against background noise.
The most common version is the QuickSIN (Quick Speech-in-Noise) test which takes only a couple of minutes to complete. You’ll listen to various sentences with background babble from multiple talkers playing at the same time. The noise level increases with each sentence, making the task progressively harder.
The result is an "SNR loss" score which measures how much louder speech has to be, relative to the background, for you to understand it compared to a normal-hearing listener.
The audiogram is great at what it does: it shows the softest sounds each ear can hear and helps diagnose and treat many kinds of hearing loss. It's an essential tool.
But the audiogram only measures whether you can hear a sound, not whether you can make sense of it. It won't tell you how you'll do with speech in noise or how tiring listening feels. So if your test says you're fine, but you still struggle at a noisy dinner, you're not imagining it. Ask your audiologist about a speech-in-noise test to measure the aspects of your hearing that the audiogram doesn’t cover.